
Retail Traders Have Left Bitcoin Futures: Can BTC USD Sweep $80,000 and Bounce?
Bitcoin hovers near $81,700 as retail traders exit futures markets. With U.S. spot Bitcoin ETFs drawing $1 billion in inflows, analysts examine whether BTC USD will sweep $80,000 and bounce.

Bitcoin (BTC USD) is holding near $81,700 on Friday, October 23, following remarks from CryptoQuant CEO Ki Young Ju indicating that retail participants have exited Bitcoin futures markets. This dynamic contrasts with the data observed during the 2025 market peak, coming shortly after U.S. spot Bitcoin ETFs hauled in roughly $1 billion over a three-day span. Although the asset’s price has retreated by $3,000 since Wednesday’s peak, underlying buyer demand remains present.
The price of Bitcoin registers a 0.2% decline over 24 hours and a 0.6% drop over the week. Consequently, market observers are asking whether a quieter futures environment signals a market bottom, and which specific price levels are critical for BTC USD right now.
Retail traders are gone from BTC futures markets, the exact opposite of what we saw at the top. https://t.co/7cdtVHsVgG pic.twitter.com/3O4lmbOfSd
— Ki Young Ju (@ki_young_ju) October 22, 2026
BTC USD: Why Does It Matter That Retail Left Futures?
Crowded markets historically tend to form tops. CryptoQuant’s data categorizes futures trading activity according to average order size. Throughout the summer of 2025—when BTC traded between $110,000 and $120,000 ahead of its October record—small-scale retail orders dominated nearly every single session. Retail participants continued to drive the trend as prices descended into January.
The current environment shows a complete reversal. Since May, no market phase has been led by retail participation. Large whale orders established the July low near $58,000, while mid-sized whale allocations propelled the September rally to $87,000. October has remained largely neutral, though whales continue to show activity.
This does not guarantee that a definitive market bottom is in place. Retail traders also dominated from February to April 2026 when BTC fluctuated between $63,000 and $75,000, prior to a further slide down to $58,000 in July. Instead, the current dynamic indicates that the market is carrying less speculative leverage from small-scale traders, meaning fewer accounts are exposed to liquidation during downturns.
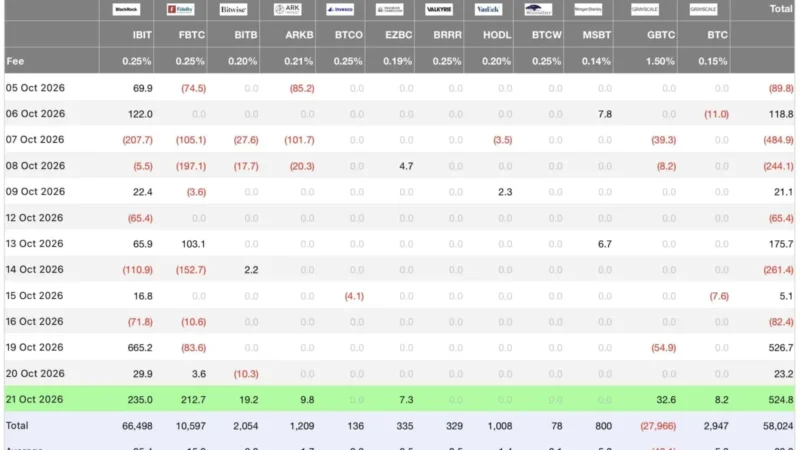
Spot market flows reflect a similar sentiment. U.S. spot Bitcoin ETFs accumulated roughly $1.07 billion between Monday and Wednesday, successfully pushing October’s aggregate flows back into positive territory.
DISCOVER: Bitcoin ETFs Turn October Positive With $1 Billion in Three Days While ETH Funds Bleed $1 Billion
Are Bitcoin ETFs Still Buying?
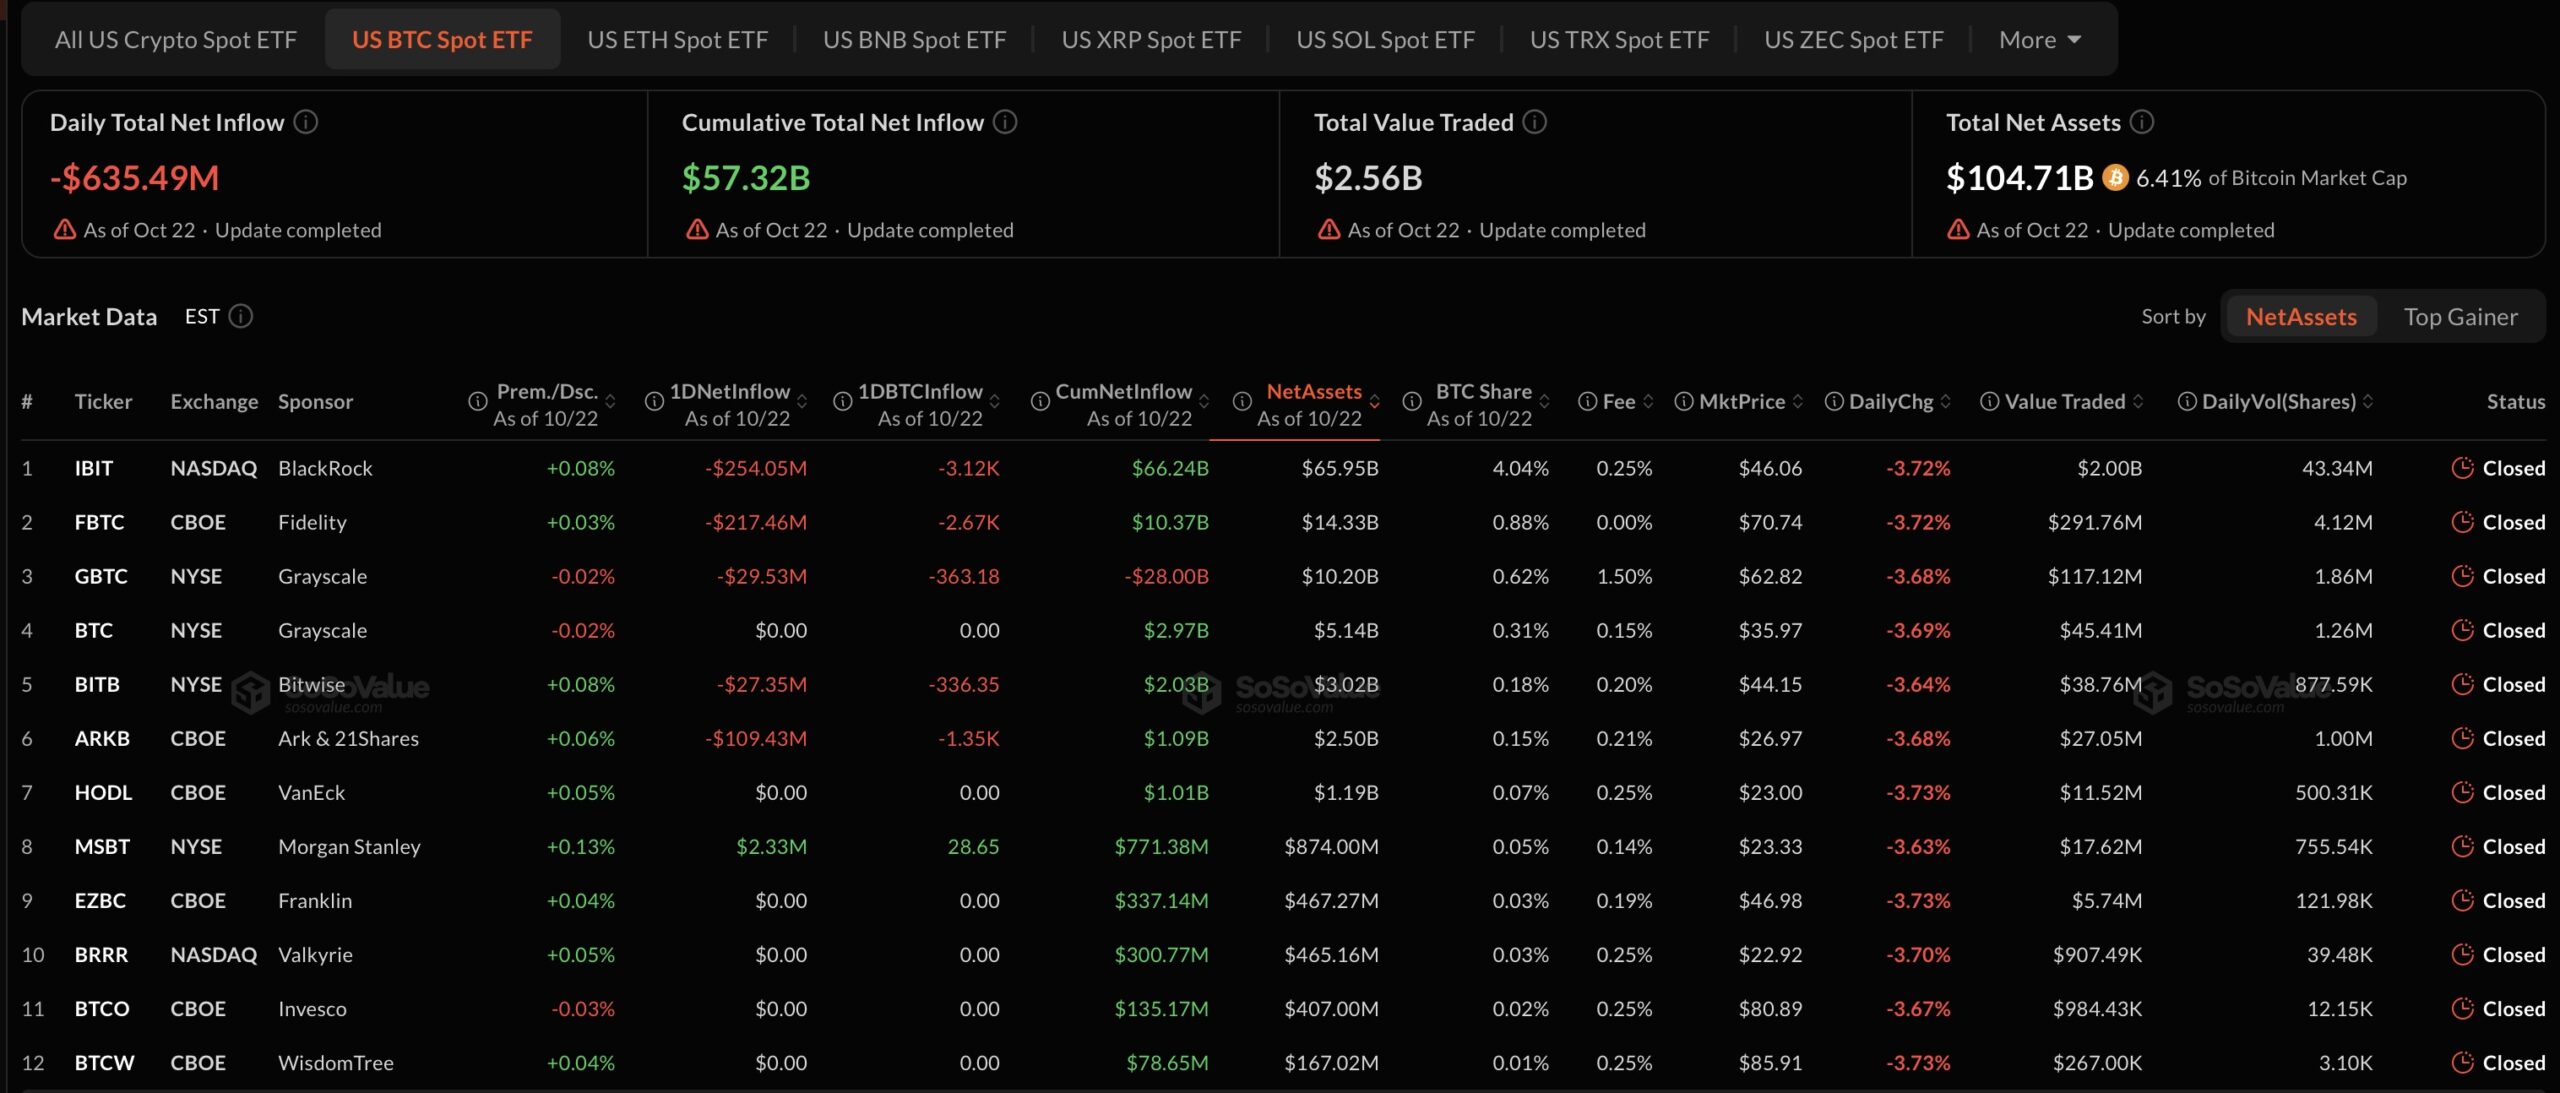
Yes, and transaction sizes remain substantial. U.S. spot Bitcoin exchange-traded funds recorded inflows of $526.7 million on Monday, $23.2 million on Tuesday, and $524.8 million on Wednesday, bringing the three-day total to approximately $1.07 billion. This accumulation was sufficient to flip October’s cumulative flows positive.
BlackRock’s IBIT led the sector once again, securing $235 million on Wednesday alone. Meanwhile, Ethereum investment funds experienced an opposite trend, enduring continuous capital outflows.
Taking these factors together, the week’s selling pressure appears driven by short-term traders rather than long-term capital exiting the asset class. Institutional ETF inflows of this magnitude have frequently preceded historical upward market rallies.
DISCOVER: Bitcoin ETFs Turn October Positive With $1 Billion in Three Days While ETH Funds Bleed $1 Billion
BTC USD Price Analysis: Will $79,800 Hold?
BTC has re-entered the sideways trading channel maintained since October 10, oscillating roughly between $79,800 and $84,300. Wednesday’s attempted breakout to $84,898 above this ceiling failed to sustain itself within a 24-hour window.
From a technical standpoint, short-term damage includes a broken trendline. Thursday’s correction breached the ascending support line that had protected every market dip originating from the October 15 low, with BTC currently retesting that line from underneath near $82,000.
Update: Still alive. Bitcoin doing a little bearish retest of trendline here and we can continue down to Seppuko land. https://t.co/KaNIrsKPE8 pic.twitter.com/iIObZMGEMt
— VikingXBT (@VikingXBT) October 23, 2026
Immediate overhead resistance is situated between $82,000 and $82,850, encompassing the trendline, prior swing highs, and the 4-hour moving averages. A successful reclaim of these markers would place the $84,300 level back into focus.
On the downside, the 50-day EMA sits at $80,876, while the October 15 low of $79,800 acts as the fundamental floor for the broader range. A swift liquidity sweep beneath $79,800 followed by an immediate recovery would form a classic market shakeout and present a clean setup for a price bounce. Conversely, a confirmed daily candlestick close below this threshold would target the 200-day EMA near $76,200.
EXPLORE: J.P. Morgan Projects 10% a Year for Bitcoin: The Bank’s Own Bear Case Points to $25,000
One More Thing: Does the McRib Move Bitcoin?
Crypto Twitter utilizes a less orthodox metric for assessing Bitcoin market trajectories. With McDonald’s reintroducing the McRib sandwich “as early as 10/27,” social media analyst internbrah pointed out to an audience exceeding 400,000 viewers that:
BTC historically goes up >2x after the McRib returns. Don’t fade the McRib.
The McRib is back on 10/27. BTC historically goes up >2x after the McRib returns. Don't fade the McRib.
Not financial advice.
— internbrah (@internbrah) October 22, 2026
Historical data reveals mixed results. Out of the past seven McRib re-releases, Bitcoin more than doubled in value within a year on two occasions: December 2020 and November 2023. Following the November 2021 rollout, the asset reached a cycle peak nine days later before surrendering two-thirds of its valuation. Following the November 2025 return, BTC never managed to trade at higher levels.
| McRib return | BTC price | Best gain within 12 months |
|---|---|---|
| October 2019 | $8,246 | +49% |
| December 2020 | $19,201 | +252% |
| November 2021 | $61,004 | +11%, then −67% |
| October 2022 | $20,496 | +68% |
| November 2023 | $35,437 | +106% |
| December 2024 | $96,675 | +29% |
| November 2025 | $102,997 | none |
Ultimately, the McRib holds a two-for-seven success rate for doubling investors’ capital—performance matching what one might expect from fast-food promotion indicators. For technical market participants tracking BTC USD, defending the $79,800 price level remains significantly more important than restaurant menu schedules.
EXPLORE: Best Crypto Presales With Asymmetric Upside in the Current Market
Frequently Asked Questions
4 questions01Why is retail trader absence in Bitcoin futures considered significant?
Crowded retail markets with high leverage historically signal market tops. Without a heavy presence of small leveraged traders, there is less risk of cascading retail liquidations during price pullbacks.
02How much did U.S. spot Bitcoin ETFs inflow recently?
U.S. spot Bitcoin ETFs took in approximately $1.07 billion over a three-day span from Monday to Wednesday, turning October’s overall fund flows positive.
03What are the critical price levels to watch for BTC USD?
Key resistance zones sit between $82,000 and $82,850, while immediate support levels include the 50-day EMA at $80,876 and the broader range floor at $79,800.
04Does the return of the McRib actually impact Bitcoin prices?
Historically, the McRib has a limited correlation with Bitcoin’s price movements, having doubled investors’ money within 12 months in only two out of its last seven promotional returns.
Related stories

China Wants $5.1B in Bitcoin, Now HSBC Is Launching RedCoin in Hong Kong
China moves to seize 61,896 Bitcoin valued at $5.1 billion from a fraud case, while HSBC launches its…

Bitcoin Price Today: US Money Supply Hits $23.3Tn – Why is BTC USD Falling Below $82,000?
Bitcoin price fell back below $82,000 as renewed selling pressure threatened the $80,000 support level, with analysts pointing…
Bitcoin ETFs Turn October Positive With $1 Billion in Three Days While ETH Funds Bleed $1 Billion
U.S. spot Bitcoin ETFs turned October positive with over $1 billion in inflows over three days, while Ethereum…

J.P. Morgan Projects 10% a Year for Bitcoin: The Bank’s Own Bear Case Points to $25,000
J.P. Morgan Asset Management projected an annual return of 10 percent for Bitcoin over the next decade in…