
BTC USD Holds $74,000 Through a Third Day of ETF Outflows: Is the Bottom In For Bitcoin?
Bitcoin hovers near $74,500 amid ongoing U.S. spot ETF outflows and market fear, while corporate giant Strategy continues aggressive accumulation and miners liquidate assets.

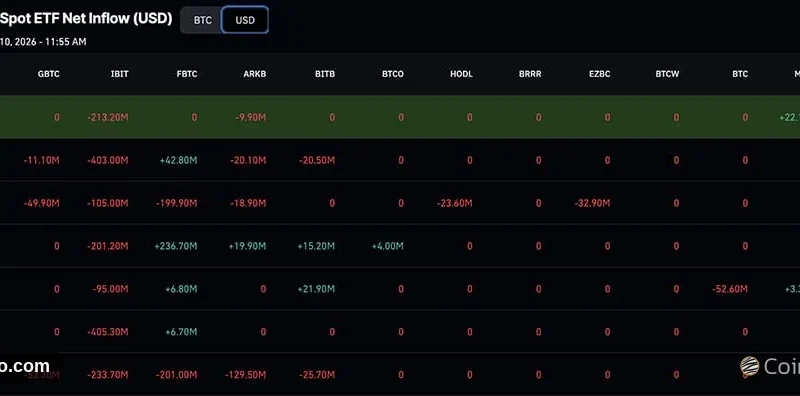
Bitcoin (BTC USD) is trading near $74,500 on Tuesday following yet another session of net outflows from U.S. spot Bitcoin exchange-traded funds (ETFs). Monday saw investors withdraw a net $201 million, marking three consecutive days of losses, with BlackRock’s IBIT fund accounting for $213 million of those departures.
However, accumulation continues elsewhere. Strategy, the leading corporate holder of Bitcoin, expanded its reserves by purchasing 1,037 BTC last week, bringing its total treasury to 850,364 BTC.
Saylor bought $81.9M of BTC and $188.3M of STRC.
Strategy now holds $63.42B of BTC, purchased at an average price of $75,456.
Saylor still holds $4.9B USD, and can buy back up to $560M of STRC under the current repurchase program. pic.twitter.com/ZPUuzCZEZt
— Arkham (@arkham) November 10, 2026
Having maintained its position above Sunday’s low of $73,510, some market participants are beginning to speculate whether a market bottom is in place. Meanwhile, the Fear & Greed Index—a daily sentiment metric scaled from 0 to 100—currently registers at 32, signaling a prevailing atmosphere of fear.
Historical analysis of similar sentiment levels reveals a cautious outlook. Since 2018, whenever the index hovered between 26 and 35, BTC traded higher 30 days later only 46% of the time, marking the weakest performance among all sentiment ranges.
Consequently, the central question remains: has Bitcoin reached its cyclical floor?
Bitcoin ETF Investors Pulled Money for a Third Straight Day: What’s Going On?
Although the pace of distribution has moderated, the downward pressure persists. Monday’s $201 million redemption was roughly half the volume recorded on Friday, yet it prolonged a streak of daily outflows originating last Thursday.
- BlackRock’s IBIT: Saw $213 million exit, surpassing the total net outflow of the entire group.
- ARK 21Shares’ ARKB: Registered $9.9 million in outflows.
- Morgan Stanley’s MSBT: Stood as the sole fund attracting fresh capital, bringing in roughly $22 million.
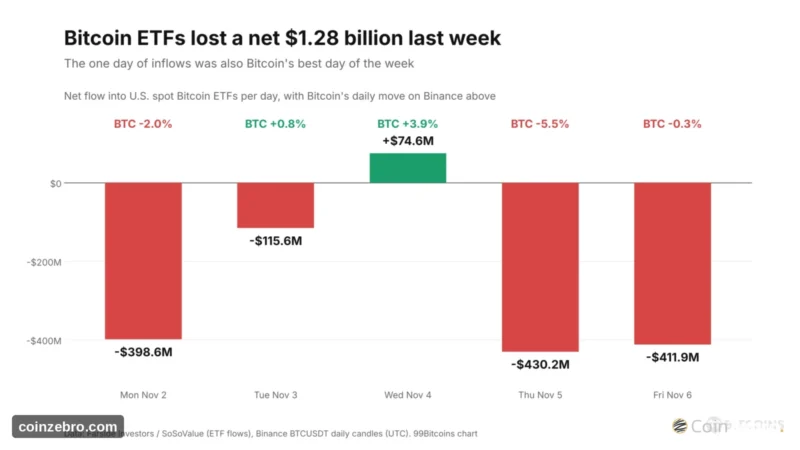
The preceding week proved significantly more severe, with these vehicles suffering a combined net loss of $1.28 billion between November 2 and 6, driven largely by $1.21 billion in outflows from IBIT.
ETF activity directly influences price dynamics. When participants redeem shares from a spot ETF, the issuer must liquidate underlying Bitcoin to fulfill withdrawals, meaning persistent outflows translate into continuous market selling.
DISCOVER: Top 20 Crypto to Buy in 2026
BTC USD Price: Strategy Buys While Miners Sell – What’s the Play?
Strategy adopted an opposing strategy. Its acquisition of 1,037 BTC equated to approximately $77 million based on current valuations. Corporate disclosures indicate the firm now controls 850,364 BTC, representing roughly 4% of the eventual total supply.
The enterprise continues incremental accumulation, having integrated 2,698 BTC since the current quarter commenced on October 1.
Additional accumulation is evident elsewhere. On-chain analytics provider Lookonchain noted that a newly created wallet extracted 1,489 BTC (valued at roughly $111 million) from custodian BitGo on Tuesday. Concurrently, three additional fresh wallets withdrew approximately 1,003 BTC from Binance over the prior 24 hours. Outflows from centralized exchanges to private storage generally indicate intent to accumulate for the long term.
Conversely, mining entities are liquidating assets into the market weakness. MARA Holdings, a prominent Bitcoin miner, transferred another 500 BTC on Tuesday, bringing its total sales volume to 13,597 BTC since October 1, according to Lookonchain data.
DISCOVER: Retail Bitcoin Holders Are Sending Coins to Binance at a Six-Month High While Whales Pull Back: Who Is Right About $80,000?
Is The Bottom In? Fear Readings Like Today’s Have Not Marked Bottoms
Market fear alone does not serve as a reliable buy signal. A comprehensive review pairing every daily Fear & Greed Index reading since February 2018 with subsequent 30-day BTC performance metrics across 3,171 days on Binance demonstrates distinct trends:
- Extreme fear, 15 or below: BTC traded higher 30 days later 65% of the time, delivering a median gain of 4.2%.
- Fear, 26 to 35 (current index range): BTC traded higher only 46% of the time, posting a median loss of 1.3%.
- All historical days: BTC posted gains 54% of the time overall.
This year’s price behavior aligns with this historical trend. When Bitcoin bottomed out at $57,800 on July 1, the sentiment index registered at 11, deep within the extreme fear bracket. Today’s reading of 32 remains relatively mild by historical comparison.
While available data cannot definitively rule out a local bottom at $73,510, historical precedents indicate that major bottoms typically coincide with significantly deeper levels of market fear.
BTC USD Price Analysis: Can Bitcoin Hold $73,510?
Thus far, support has held firm, though the subsequent recovery has been muted. BTC changes hands at $74,467 on Binance, remaining approximately 1.3% above Sunday’s low.
On the four-hour timeframe, Bitcoin continues to trade beneath both of its principal simple moving averages (SMAs)—calculated using the past 50 and 200 closing prices. The 50-period SMA is positioned at $76,660, while the 200-period SMA stands at $80,188.
- Resistance: Identified at $75,568 (Monday’s peak), followed by the 50-period SMA at $76,660, and higher up at the 200-period SMA near $80,188.
- Support: Located at $73,750 (Monday’s trough), followed by Sunday’s low of $73,510, and the August 21 low at $73,027 further down.

BTCUSDT 4H chart. Source: Binance.
| Path | What has to happen | Next stop |
|---|---|---|
| Push higher | A close above $75,568 | $76,660, the 50-period SMA |
| Stall | BTC holds between $73,510 and $75,568 | A tight range below both SMAs |
| Slip | A close below $73,510 | $73,027, the August 21 low |
For the BTC USD pair, subsequent market direction will likely hinge on Tuesday’s ETF flow reports. A fourth consecutive session of outflows would signal continued institutional selling, whereas a pivot back toward net inflows would improve the probability that the $73,510 low remains intact.
DISCOVER: 15+ Upcoming Coinbase Listings to Watch in 2026
Follow 99Bitcoins on X For the Latest Market Updates, and Subscribe on YouTube For Daily Expert Market Analysis.
Frequently Asked Questions
5 questions01What is the current trading price of Bitcoin (BTC USD)?
Bitcoin is holding near $74,500 (specifically around $74,467 on Binance).
02Are Bitcoin ETFs currently seeing inflows or outflows?
U.S. spot Bitcoin ETFs are experiencing outflows, having logged a net loss of $201 million on Monday, marking three consecutive days of negative flows.
03What is Strategy’s current Bitcoin holding?
Strategy holds 850,364 BTC, having purchased an additional 1,037 BTC last week.
04What does the Fear & Greed Index indicate right now?
The Fear & Greed Index sits at 32, placing market sentiment in the “fear” category.
05What are the key technical support and resistance levels for Bitcoin?
Immediate support rests at $73,750 and Sunday’s low of $73,510, while resistance is found at Monday’s high of $75,568 and the 50-period SMA at $76,660.
Related stories
Strategy and Trump Media Bought the Bitcoin News: Is CPI the Trigger BTC Needs?
Despite major Bitcoin purchases by Strategy and Trump Media, Bitcoin prices fell as markets awaited the crucial U.S.…
BlackRock Bitcoin ETF Sees $213M Outflow as CPI Report Tests Crypto Markets
BlackRock's Bitcoin and Ethereum investment products experienced massive withdrawals totaling $332.5 million as investors positioned themselves defensively ahead…
BTC USD Breaks Below 50-Week Average After $1.28B ETF Outflows: Is The Selling Finally Over?
Bitcoin drops to $73,510 following $1.28 billion in U.S. spot ETF outflows and a liquidation cascade on Sunday,…
Bitcoin Price Stalls as Gold Surges: Is a Major Crypto Catch-Up Rally Coming?
Bitcoin prices recently dipped to $73,700 while gold surged past $4,100, driven by growing institutional demand for scarce…