
BTC USD Breaks Below 50-Week Average After $1.28B ETF Outflows: Is The Selling Finally Over?
Bitcoin drops to $73,510 following $1.28 billion in U.S. spot ETF outflows and a liquidation cascade on Sunday, closing below its 50-week moving average for the first time in two months.
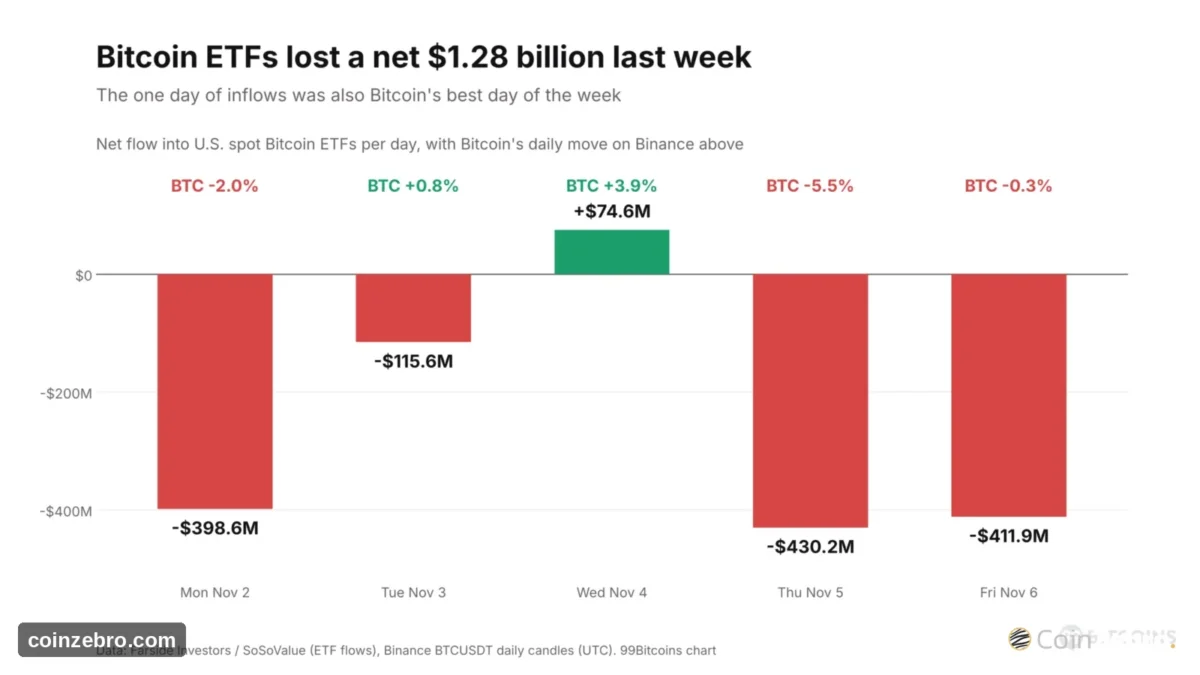
Bitcoin (BTC USD price) dropped to $73,510 on Binance late Sunday, hitting its lowest price since August 21. This followed a week that saw investors withdraw a net $1.28 billion from U.S. spot Bitcoin exchange-traded funds (ETFs).
These two developments reinforced one another. ETF holders consistently sold throughout the week, while a cascade of forced selling by leveraged traders on Sunday evening pushed Bitcoin down 2.8% within ten minutes.
On Monday morning, BTC trades at $74,224, marking a 0.8% decline for the day. Sunday’s downturn also confirmed a fifth consecutive weekly loss and the first weekly close below the 50-week average in two months.
Market sentiment remains fragile. The Fear & Greed Index, a daily sentiment indicator ranging from 0 to 100, registered 29 on Monday morning, indicating a state of fear.
The key question remains: is the selling finished, or does Bitcoin face additional declines?
BREAKING: Bitcoin's weekly candle just closed below the 50-week MA for the first time in 2 months.
Two paths from here:
1) If the bulls push Bitcoin back above the 50-week MA this week, it confirms a classic fakeout designed to trigger panic sells.
2) If we see another weekly… pic.twitter.com/SY5BEjcCvU
— Ash Crypto (@AshCrypto) November 9, 2026
DISCOVER: 9+ Best High-Risk, High-Reward Crypto to Buy in 2026
ETF Selling Lined Up With Bitcoin’s Worst Days: Sunday’s Cascade Ranked Among the Year’s Sharpest Five-Minute Drops
The funds endured a difficult week. Farside Investors, a tracker of daily fund flows, recorded net outflows during four of the five trading sessions between November 2 and November 6, totaling a net exit of $1.28 billion.
- Monday, November 2: $398.6 million exited as BTC dropped 2.0%.
- Tuesday: $115.6 million exited, despite BTC gaining 0.8%.
- Wednesday: $74.6 million entered, representing the sole day of inflows, accompanied by a 3.9% gain in BTC.
- Thursday: $430.2 million exited, marking the largest withdrawal of the week as BTC dropped 5.5%.
- Friday: $411.9 million exited, with BlackRock’s IBIT fund accounting for $403 million of those outflows.
These figures reflect actual buying and selling activity. When capital is withdrawn from a spot ETF, the fund must liquidate Bitcoin holdings to fulfill redemptions, meaning four days of outflows translated into continuous selling pressure heading into the weekend.
Then arrived Sunday. At 21:44 UTC, BTC stood at $75,607 on Binance, before touching $73,510 just eleven minutes later. The most severe movement occurred during a five-minute window from 21:55 UTC, when Bitcoin dropped 1.9%. An analysis of all 105,127 five-minute candles recorded on Binance over the past year reveals that only ten experienced a steeper decline.
The event exhibited the characteristics of a liquidation cascade, which involves a domino effect of forced liquidations. Traders utilizing borrowed funds to speculate on higher prices face automated position closures when valuations drop below specified thresholds, with each forced sale driving the price further down toward subsequent order blocks.
Ethereum experienced the downturn first, with ETH tumbling 6.9% on Binance between 21:50 and 21:55 UTC—nearly triple Bitcoin’s 2.4% drop over the same period.
External headlines also provided traders with an incentive to reduce exposure. Earlier on Sunday, CNBC reported that Nvidia’s board initiated an investigation into CEO Jensen Huang’s connections to an individual whom U.S. intelligence agencies suspected of sharing intelligence with Beijing. Because traditional stock markets were closed, cryptocurrency served as the only active market available for liquidation.
This dynamic was amplified by low weekend liquidity. A typical weekend hour on Binance processes roughly half the volume of a weekday hour, allowing identical selling pressure to generate larger price movements.
EXPLORE: Bitcoin Price Stalls as Gold Surges: Is a Major Crypto Catch-Up Rally Coming?
A Fifth Red Weekly Candle Closed Below the 50-Week Average
Sunday’s decline inflicted its heaviest damage on the weekly timeframe. The weekly candle settled at $74,851, down from its opening price of $78,354, sealing Bitcoin’s fifth consecutive losing week.
Furthermore, the close occurred below the 50-week simple moving average (MA)—representing the mean of the prior 50 weekly closes—which stands at $75,535. This marks the first weekly close below this benchmark since the week of September 7, two months prior.
Stringing together five consecutive losing weeks is an uncommon occurrence. Historical weekly data from Binance dating back to August 2017 shows Bitcoin experiencing five or more consecutive weekly losses on only three previous occasions. In each instance, BTC traded lower than the fifth weekly close within the subsequent 12 weeks:
- November 2018: Prices fell an additional 23% prior to reaching the cycle low.
- April 2022: Prices fell an additional 54%.
- February 2026: Prices fell an additional 8% before concluding the 12-week window 15% higher.
While three occurrences represent a limited dataset, market lows materialized following the fifth red week in all past instances rather than directly on it.
BTC USD Price Analysis: Can Bitcoin Hold $73,510?
At present, it is holding, though by a narrow margin. BTC USD recovered to $75,735 within two hours of Sunday’s low before retreating to $74,224, sitting roughly 1% above that trough.
On the four-hour chart, where individual candles represent four-hour intervals, Bitcoin trades beneath both of its exponential moving averages (EMAs), which place greater weight on recent price action. The 50-period EMA is positioned at $76,845, while the 200-period EMA rests at $79,444.
- Resistance: $75,735 (Sunday’s recovery high), followed by the 50-period EMA at $76,845, and the 200-period EMA at $79,444.
- Support: $73,510 (Sunday’s low), followed by the August 21 low at $73,027.

| Path | What has to happen | Next stop |
|---|---|---|
| Push higher | A close back above $75,735 | $76,845, the 50-period EMA |
| Stall | BTC holds between $73,510 and $75,735 | A range below both EMAs |
| Slip | A close below $73,510 | $73,027, the August 21 low |
BTC USD participants will monitor Monday’s ETF flow data closely. Another session of outflows would signal that institutional funds continue to offload assets into an already vulnerable market.
DISCOVER: 15+ Upcoming Coinbase Listings to Watch in 2026
Follow 99Bitcoins on X For the Latest Market Updates, and Subscribe on YouTube For Daily Expert Market Analysis.
Frequently Asked Questions
4 questions01Why did Bitcoin fall to $73,510 on Binance?
Bitcoin’s drop to $73,510 was driven by a combination of $1.28 billion in net outflows from U.S. spot Bitcoin ETFs throughout the week and a wave of forced liquidations by leveraged traders on Sunday evening. Thin weekend trading and macroeconomic headlines also contributed to the rapid price decline.
02How much money left U.S. spot Bitcoin ETFs during the week?
Investors pulled a net total of $1.28 billion out of U.S. spot Bitcoin exchange-traded funds over the course of the week.
03What is the significance of Bitcoin closing below the 50-week average?
Sunday’s price action resulted in Bitcoin’s first weekly close below its 50-week simple moving average in two months, as well as its fifth consecutive losing week, a rare technical occurrence that has historically preceded further downside in past cycles before finding a definitive bottom.
04What are the immediate support and resistance levels for BTC?
Immediate support levels sit at Sunday’s low of $73,510, followed by the August 21 low of $73,027. Resistance levels are found at Sunday’s rebound high of $75,735, the 50-period EMA at $76,845, and the 200-period EMA at $79,444.
Related stories
Elon Musk Grok AI Predicts a Huge Bitcoin Price Rally: Can it Really Go This High?
Elon Musk's Grok AI predicts Bitcoin could surge between $280,000 and $350,000 under a hypothetical scenario involving sovereign…
Strategy and Trump Media Bought the Bitcoin News: Is CPI the Trigger BTC Needs?
Despite major Bitcoin purchases by Strategy and Trump Media, Bitcoin prices fell as markets awaited the crucial U.S.…

BTC USD Holds $74,000 Through a Third Day of ETF Outflows: Is the Bottom In For Bitcoin?
Bitcoin hovers near $74,500 amid ongoing U.S. spot ETF outflows and market fear, while corporate giant Strategy continues…
BlackRock Bitcoin ETF Sees $213M Outflow as CPI Report Tests Crypto Markets
BlackRock's Bitcoin and Ethereum investment products experienced massive withdrawals totaling $332.5 million as investors positioned themselves defensively ahead…