
Bitcoin Below Its 200-Week Average for the First Time Since 2022: Is a Drop to $50K Coming or a Historic Buying Opportunity?
Bitcoin closed below its 200-week moving average, triggering warnings from Wintermute of a potential drop into the $50,000 range while River highlights historical buying opportunities.
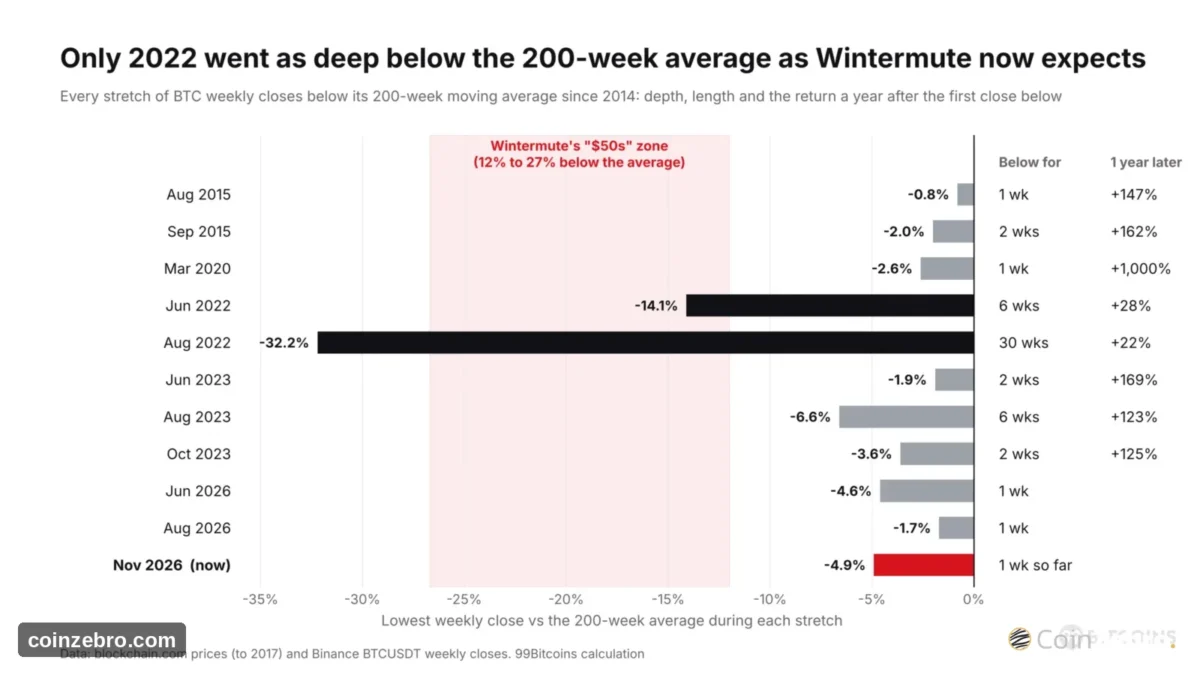
Bitcoin (BTC USD) concluded last week at $65,351, marking its initial weekly close below the 200-week moving average since August. On Monday, November 16, liquidity provider Wintermute cautioned that it anticipates “pressure into the $50s.” The 200-week average, representing Bitcoin’s average weekly close over roughly a four-year period, is positioned near $68,000.
Conversely, Bitcoin broker River highlighted a different perspective, noting that Bitcoin has traded below that threshold for only about 8% of its existence, and purchases made during those phases have historically been lucrative.
An examination of every week since 2014 shows that BTC USD has fallen beneath this average ten times previously. Seven of those occurrences lasted for two weeks or less, with only the 2022 bear market plunging as deeply as Wintermute’s projected target.
The core question for BTC USD is whether the trader’s cautious outlook or historical precedent will prevail.
Bitcoin has only been below its 200-week moving average for 8.4% of its lifetime.
Average return on bitcoin bought during these periods:
1 year later: +120%
3 years later: +582% pic.twitter.com/ob1U57jmhj— River (@River) November 16, 2026
Wintermute’s Bitcoin Warning: “The ETF Bid Is Gone”
In a November 16 market update, Wintermute stated, “We haven’t cleared the bear market yet,” characterizing the market recovery from the July low as “a fake-out.” Bitcoin dropped 12.7% over the previous week while the S&P 500 rose 2.5%.
The firm’s thesis centers on capital flows:
- ETFs: U.S. spot Bitcoin exchange-traded funds (ETFs) carry a net negative balance of roughly $1.9 billion for 2026, following $21 billion in inflows throughout 2025.
- Stablecoins: Total supply contracted by $14 billion to $16 billion over a 30-day window, signaling that “no fresh dollars are arriving.” Figures from DefiLlama corroborate this, indicating a $16.1 billion reduction to $288.2 billion.
- Rates: Markets have priced in a December Federal Reserve rate hike at roughly 92%, while the 10-year Treasury yield finished at 5.15%. Because Bitcoin yields no income, it tends to face liquidation first.
- Liquidations: Approximately $1.7 billion was wiped out during the 24 hours leading into Sunday, with 80% consisting of long positions. Wintermute views the subsequent rebound as short covering rather than organic accumulation.
Wintermute identifies Saturday’s low of $62,000 as an initial level, pointing to the $60,000 options cluster on Deribit as “the next magnet.” The firm indicated it would soften its defensive stance only if BTC USD records a daily close back above the 200-week average near $68,000, accompanied by net ETF inflows on that same day.
Nevertheless, Wintermute included a caveat, noting that closes beneath the 200-week average “remain interesting for patient, high-conviction capital on a multi-quarter view.”
DISCOVER: Top 20 Crypto to Buy in 2026
BTC USD Below the 200-Week Average: Every Past Case Since 2014
Data from River indicates that Bitcoin has spent 8.4% of its timeline under the 200-week average, yielding average returns of 120% one year later and 582% three years later. An independent tally of weekly closes since the inception of the moving average in 2014 places that figure at 8.3%.
- Most dips were short: Seven of the ten prior instances lasted one or two weeks, and none exceeded 5% below the moving average.
- 2022 was the exception: Two distinct stretches occurred that year, with the second extending for 30 weeks and reaching 32% under the average following the collapse of FTX.
- One year later: Across all eight instances with a complete year of subsequent data, BTC USD traded higher than its initial weekly close below the line. Gains varied from 22% post-2022 to 1,000% following the March 2020 crash.
- This year: BTC slipped beneath the benchmark for a single week in late June and again in August, staging a full recovery on both occasions.
Wintermute’s projection is what sets the current week apart. A descent into the $50,000 range equates to trading 12% to 27% under the moving average—a depth witnessed only during 2022 across the asset’s 12-year history.
DISCOVER: BTC USD Hits $62,006 After a Weekend Dump: Did MARA’s Bitcoin Sales Cause It?
BTC USD Price Analysis: The 200-Week Line Is Now Resistance
On the weekly chart, where each individual candle represents one week of price action, BTC USD changes hands at $64,419. It resides below its 200-week simple moving average (SMA)—a straightforward calculation of the prior 200 weekly closes—currently at $68,191, as well as its 50-week SMA at $74,516.
- Resistance: Found at $68,191 (the 200-week average). Higher up is $75,000, a threshold that has successfully repelled Bitcoin on multiple occasions since March 2024, most recently in September.
- Support: Located at $61,000, where the peak from 2021 converges with this year’s lows from February and November. Further down sits $53,000, intersecting the 2021 highs and 2024 lows inside Wintermute’s target zone.

BTCUSDT 1W chart. Source: TradingView
| Path | What has to happen | Next stop |
|---|---|---|
| Push higher | A weekly close back above the 200-week average, $68,191, with ETF inflows | $75,000 and the 50-week average |
| Stall | Weekly closes between $61,000 and $68,191 | A base like the brief dips of 2023 |
| Slip | A weekly close below $61,000 | $53,000, inside Wintermute’s $50,000s |
DISCOVER: The 12+ Hottest Crypto Presales to Buy Right Now
While history favors buyers who acquire BTC USD below the 200-week average, this assumption holds true only if the current correction mirrors past short-lived pullbacks. The capital flows cited by Wintermute bear a closer resemblance to 2022 market conditions. A weekly close recapturing the $68,191 level would validate the historical thesis, but until then, the trader’s cautious outlook remains active.
Frequently Asked Questions
4 questions01What is the 200-week moving average for Bitcoin?
The 200-week moving average represents Bitcoin’s average weekly close over roughly four years. It currently sits near $68,000 ($68,191 on the simple moving average chart).
02How often has Bitcoin dropped below its 200-week average?
Historically, Bitcoin has spent only about 8% to 8.4% of its lifetime trading below its 200-week moving average.
03What are Wintermute’s downside targets for Bitcoin?
Wintermute has warned of potential downward pressure pushing Bitcoin into the $50,000 range, highlighting a $60,000 options cluster on Deribit as an intermediate magnet and $53,000 as a key support level.
04What needs to happen for Bitcoin to invalidate the bear market warning?
According to market analysts, a confirmed weekly close back above the 200-week average near $68,191, paired with net positive ETF inflows on the same day, would be required to shift the current outlook.
Related stories

Perplexity AI Predicts Insane Bitcoin Price Target for 2027
What if Bitcoin’s next major rally isn’t just another cryptocurrency bull run, but the start of a fundamental…

Bitcoin Nears $62,862 Mining Cost: Will BTC Price Hold Above This Level or Break Below It?
Bitcoin is nearing its $62,862 average mining cost, raising questions about whether the cryptocurrency can hold above this…
Arthur Hayes Says Anthropic IPO Could Trigger Bitcoin Rally: Do the Numbers Agree?
BitMEX co-founder Arthur Hayes claims an Anthropic IPO pop could trigger a Bitcoin rally. However, historical data from…
Bitcoin Price Struggles Under $65K as World Bank Explores USDC Rails: Follow the Dollar Liquidity?
Bitcoin struggles below $65,000 amid ETF outflows, while the World Bank and Citi explore Circle's USDC to streamline…