
Bitcoin ETF Sellers Show No Mercy: BlackRock Leads $582M Bitcoin ETF Exodus as BTC Hits New Lows
US spot Bitcoin ETFs suffered a net loss of $582 million as BTC dropped below $62,000, led by a massive $541 million exodus from BlackRock's iShares Bitcoin Trust.
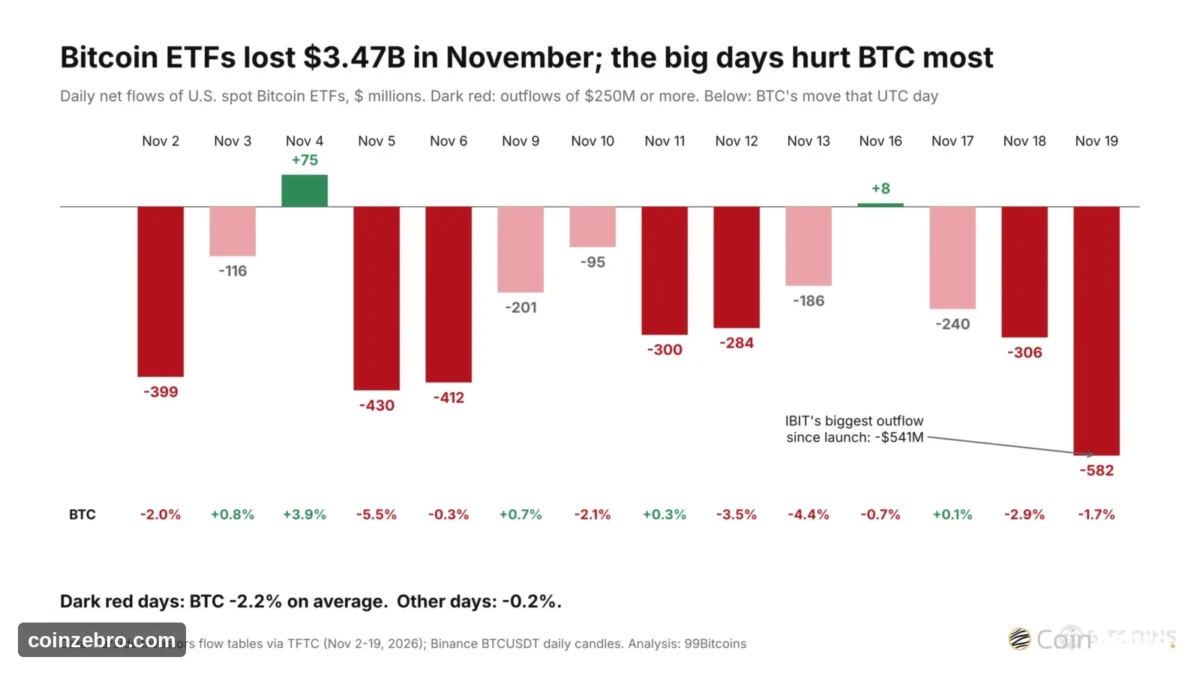
The relentless November drawdown continues to deliver consecutive red sessions for the cryptocurrency market. On Thursday, November 19, US spot Bitcoin ETFs suffered a net loss of $582 million, marking their third consecutive day of outflows as BTC USD dropped beneath the $62,000 threshold.
Nov 19 Update:#Bitcoin ETFs:
1D NetFlow: -4,658 $BTC(-$296.7M)
7D NetFlow: -15,314 $BTC(-$975.49M)#Ethereum ETFs:
1D NetFlow: -9,904 $ETH(-$17.85M)
7D NetFlow: -65,373 $ETH(-$117.82M)— Lookonchain (@lookonchain) November 19, 2026
BlackRock’s iShares Bitcoin Trust (IBIT) was responsible for $541 million of that total, representing its largest single-day redemption since its January 2024 launch. Conversely, Morgan Stanley’s newly introduced fund, MSBT, stood as the sole vehicle to record positive inflows, attracting approximately $49.6 million.
Selling pressure has persisted throughout the month. These funds have experienced capital withdrawals on 12 out of 14 trading days in November, accumulating a net loss of $3.47 billion. Based on each day’s closing price, this equates to roughly 49,400 BTC. Over the identical timeframe, Bitcoin declined by 20%, moving from $77,582 at the close of October down to $61,987 by Thursday.
Market participants are now questioning when ETF sellers will exhaust their positions and where BTC USD will establish a market floor.
BTC USD ETF Flows: $3.47 Billion Out in November
Thursday’s negative flow registered as the largest single-day withdrawal of the month. The distribution across individual funds breaks down as follows:
- BlackRock (IBIT): -$541.1 million, accounting for roughly 93% of the day’s aggregate total. IBIT has shed approximately $2.9 billion in November, exceeding the losses of any other fund.
- Fidelity (FBTC): -$45.9 million.
- ARK 21Shares (ARKB): -$31.3 million.
- Grayscale (GBTC): -$13.9 million.
- Morgan Stanley (MSBT): +$49.6 million, marking it as the only fund with positive inflows and bringing its cumulative total since inception to $888 million.
Despite this month’s downturn, US-based funds maintain substantial reserves, holding approximately $76.6 billion, which accounts for about 6.1% of Bitcoin’s overall market capitalization. Furthermore, investors have injected a cumulative net $53.5 billion since January 2024. These funds publish daily holding updates, with IBIT’s specific statistics accessible directly via BlackRock’s iShares portal.
Institutions added 49,229 BTC to US spot ETFs in Q3, their biggest quarterly buy since Q2 2025. Total holdings are a record 356,491 BTC (per Galaxy’s Alex Thorn).
Price is lower now, but the stack keeps growing. pic.twitter.com/7BKdPWXxlc
— 𝕮𝖗𝖞𝖕𝖙𝖔 𝕎𝖆𝖗𝕣𝕚𝕠𝖗 (@ScottLEOWarrior) November 20, 2026
DISCOVER: Top 20 Crypto to Buy in 2026
Big Outflow Days Hit Bitcoin Hardest: Fed Fears and Falling Tech Stocks Drive the Selling
Comparing daily ETF flow tables from November 2 through 19 against Binance’s daily BTC candles reveals distinct market behaviors when split into two categories: seven sessions featuring outflows of $250 million or greater, versus seven sessions with smaller outflows or net inflows.
- The big days: On the seven heaviest outflow sessions, BTC dropped by an average of 2.2%.
- The rest: During the remaining seven days, BTC shifted by a mere -0.2% on average.
- The exceptions: The correlation is not absolute. On November 11, $300 million departed the funds while BTC still managed a 0.3% gain. On November 13, a more modest $186 million outflow coincided with a 4.4% price decline.
Because ETF flows are calculated based on US trading hours while Bitcoin price shifts follow the UTC calendar day, the schedules do not align perfectly. Nevertheless, the overarching trend remains consistent: aggressive selling by ETF holders drives down BTC USD values because alternative buyer demand has been insufficient to absorb the supply.
DISCOVER: Bitcoin Below Its 200-Week Average for the First Time Since 2022: Is a Drop to $50K Coming or a Historic Buying Opportunity?
The ongoing ETF liquidation does not occur in isolation. On Thursday, the S&P 500 declined by 2% to register its sixth successive daily loss on the date of Anthropic’s Nasdaq listing. Bitcoin exhibits a strong directional relationship with technology equities, with Bloomberg noting that its 40-day correlation with the Nasdaq 100 has risen to 0.69—where a score of 1 indicates identical movement.
Paul Howard, senior director at the trading firm Wincent, highlighted this combination of macro pressures.
ETF outflows and the Fed’s hawkish posture are weighing on risk assets
he shared with Bloomberg. Traders anticipate that the Federal Reserve will maintain elevated interest rates, a policy stance that historically pressures both Bitcoin and tech-sector equities.
Skepticism remains regarding whether the liquidation phase has concluded. “I don’t think that flushing out is over yet,” Raj Kamal, CEO of crypto payments provider TransFi, stated to AMBCrypto.
DISCOVER: Best New Cryptocurrencies to Invest in 2026
BTC USD Price Analysis: $62,300 Turns Into Resistance
On the daily timeframe, Bitcoin changes hands at $61,939. This position rests beneath both its 50-day exponential moving average (EMA)—which assigns greater weight to recent prices—at $74,658, and its 200-day EMA at $75,470.
- Resistance: $62,300, which served as a price floor throughout June, July, and August, as well as twice earlier this month, has now transitioned into a market ceiling. The next resistance level sits at $65,500.
- Support: $58,500, a level that prompted rebounds in June and again on July 1.

| Path | What has to happen | Next stop |
|---|---|---|
| Push higher | A daily close back above $62,300, with ETF flows turning positive | $65,500, the June-August ceiling |
| Stall | Price stays between $58,500 and $62,300 | A range below the old floor |
| Slip | A daily close below $58,500 | $57,800, the July 1 low, then lower |
For BTC USD observers, daily ETF flow data remains the primary metric to monitor. A sequence of positive inflow days comparable to Monday’s session would relieve downward pressure on the $58,500 support level, whereas another $500 million redemption day akin to Thursday’s action would drastically elevate the difficulty of defending that floor.
Follow 99Bitcoins on X For the Latest Market Updates, and Subscribe on YouTube For Daily Expert Market Analysis
Frequently Asked Questions
4 questions01Why are US spot Bitcoin ETFs experiencing massive outflows?
The outflows are driven by a combination of broad market pullbacks, strong hawkish positioning from the Federal Reserve regarding interest rates, and falling tech equities (with Bitcoin’s 40-day correlation to the Nasdaq 100 reaching 0.69).
02Which fund recorded the largest single-day outflow?
BlackRock’s iShares Bitcoin Trust (IBIT) suffered a $541 million outflow on Thursday, November 19, marking its largest single-day redemption since launching in January 2024.
03Are there any spot Bitcoin ETFs experiencing inflows?
Yes, Morgan Stanley’s new fund, MSBT, stood out as the only fund to attract capital on Thursday, bringing in roughly $49.6 million and raising its total inflows since launch to $888 million.
04What are the critical price levels to watch for Bitcoin?
Bitcoin faces immediate overhead resistance at $62,300 (previously a strong floor) and $65,500, with primary downside support resting at $58,500.
Related stories
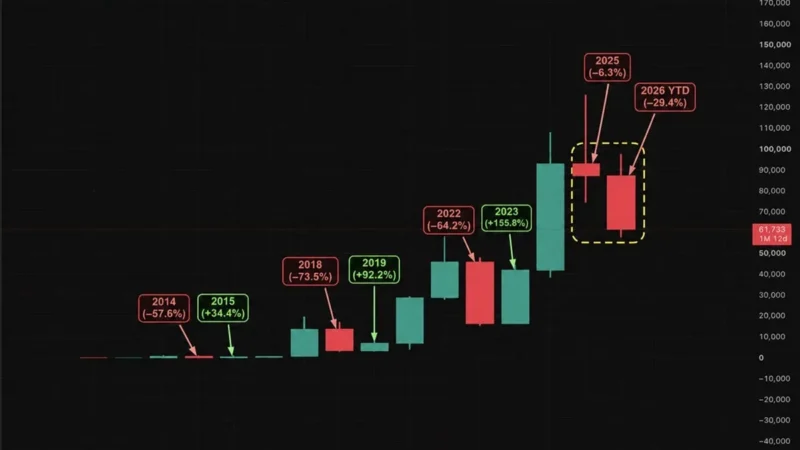
Bitcoin Price Has Never Had Two Red Years in a Row: 4-Year Cycle Broken?
Bitcoin price is heading toward an unprecedented moment in its trading history. Bitcoin has fallen 30% in 2026,…

Perplexity AI Predicts Insane Bitcoin Price Target for 2027
What if Bitcoin’s next major rally isn’t just another cryptocurrency bull run, but the start of a fundamental…

Bitcoin Nears $62,862 Mining Cost: Will BTC Price Hold Above This Level or Break Below It?
Bitcoin is nearing its $62,862 average mining cost, raising questions about whether the cryptocurrency can hold above this…
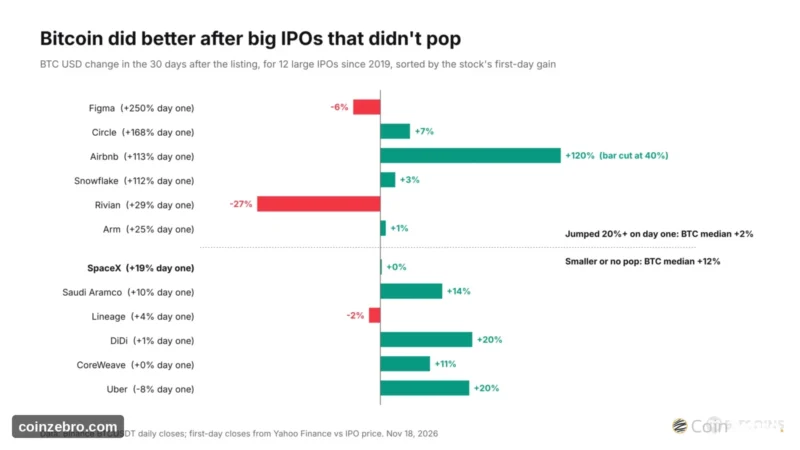
Arthur Hayes Says Anthropic IPO Could Trigger Bitcoin Rally: Do the Numbers Agree?
BitMEX co-founder Arthur Hayes claims an Anthropic IPO pop could trigger a Bitcoin rally. However, historical data from…